Empowering Financial Process Automation through Azure Cloud Services
Challenge
- Deploy Blue Prism Software (RPA) on Microsoft Azure Cloud
- Ensure high availability of BOTS for continuous operation
- Achieve end-to-end management and monitoring of the application
Solution
- Chose Microsoft Azure due to its high scalability, robust security features, and strong support for RPA technologies
- Selected Blue Prism Software for its proven efficiency in automating complex financial processes
Implementation
- Addressed challenges in configuring Azure architecture to meet stringent financial regulatory compliance
- Ensured secure data transit between on-premise datacenter and Azure Cloud

Results
Achieved a 30% increase in process speed and a 40% reduction in manual effort, leading to increased operational efficiency and enhanced customer service levels
Lessons Learned
- Early engagement with cloud architects can significantly smoothen the implementation process
- Continuous monitoring and assessment are crucial for maintaining high security and compliance standards
Future Plans
- Explore further automation opportunities within other operational areas
- Evaluate the integration of AI and machine learning to enhance process automation
Figures and Tables
- Azure Architecture Diagram
- Components: Azure Virtual Machines (VMs), Azure SQL Database, Networking (Virtual Network, Subnets, Network Security Groups), Azure Active Directory, and Blue Prism Software deployment.
- Connectivity: Depict VPN or ExpressRoute for secure connectivity between Azure and on-premise datacenter.
- Security: Illustrate security groups, firewall configurations, and other security measures
- Operational Efficiency Table:
| Metric | Pre-Implementation | Post-Implementation | Percentage Improvement |
|---|---|---|---|
| Process Speed (tasks/hour) | 200 | 260 | 30% |
| Manual Effort (man-hours/month) | 500 | 300 | 40% |
| Customer Service Levels (%) | 80% | 95% | 18.75% |
-
- Data:
- Process Speed: e.g., 200 tasks/hour pre-implementation vs 260 tasks/hour post-implementation.
- Manual Effort: e.g., 500 man-hours/month pre-implementation vs 300 man-hours/month post-implementation.
- Customer Service Levels: e.g., 80% satisfaction pre-implementation vs 95% satisfaction post-implementation.
- Percentage Improvement: Calculate the percentage difference for each metric.
- Data:
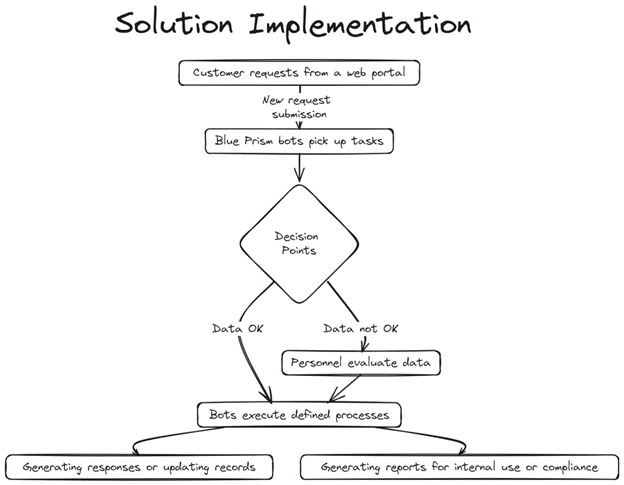
- Process Flow Diagram:
- Input: Source of data or trigger for the process.
- Processing: Tasks performed by Blue Prism bots, decision points, and any human intervention.
- Output: Resulting data or actions, final storage or reporting.
Customer Quote
“The automation solution not only streamlined our processes but also significantly enhanced customer satisfaction. We look forward to exploring more innovative solutions.”
Conclusion
The initiative significantly elevated operational efficiency and customer service levels by harnessing Azure Cloud Services for process automation

